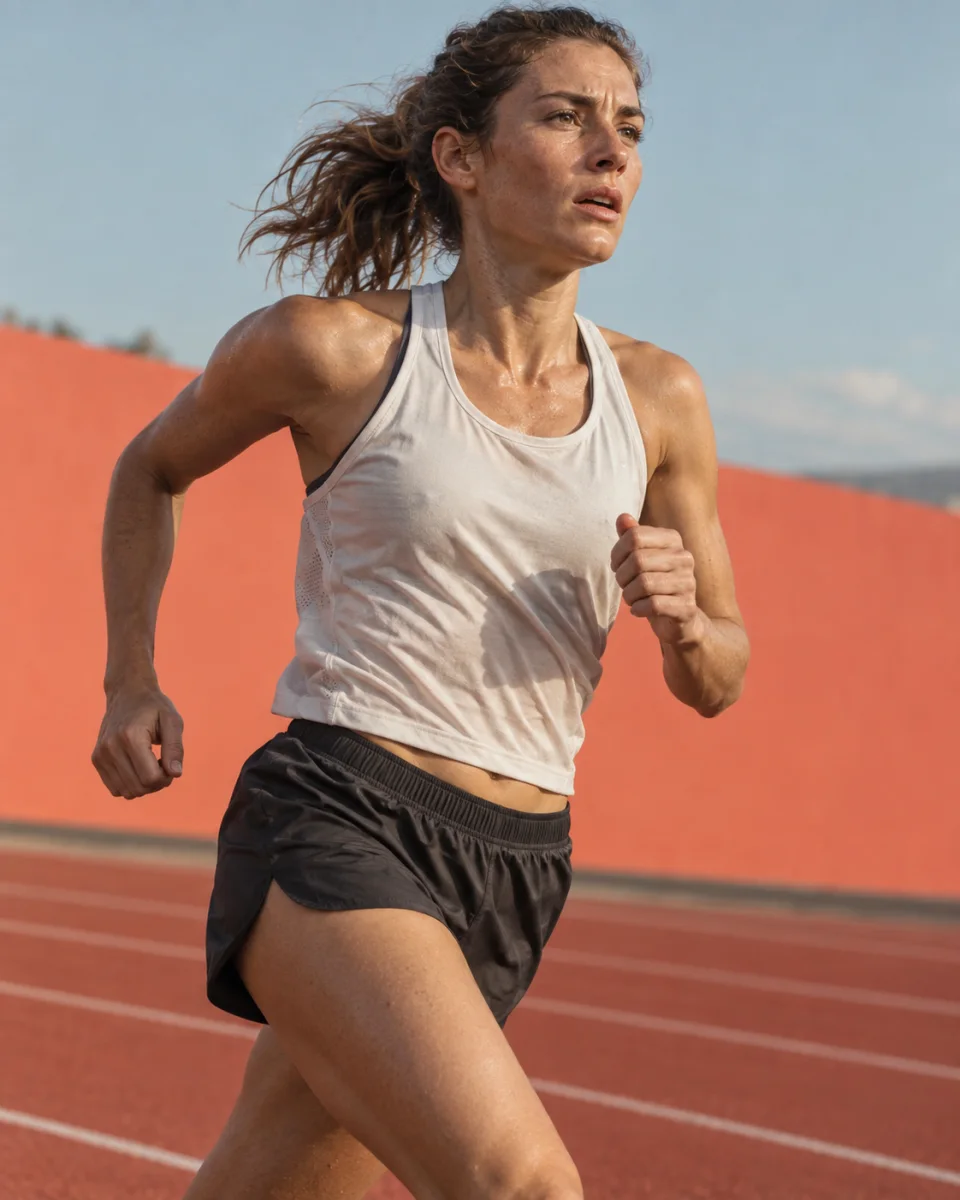
Illustrative data · 01
Running
Threshold pace and heart rate in one usable result.
LT24:08 /km
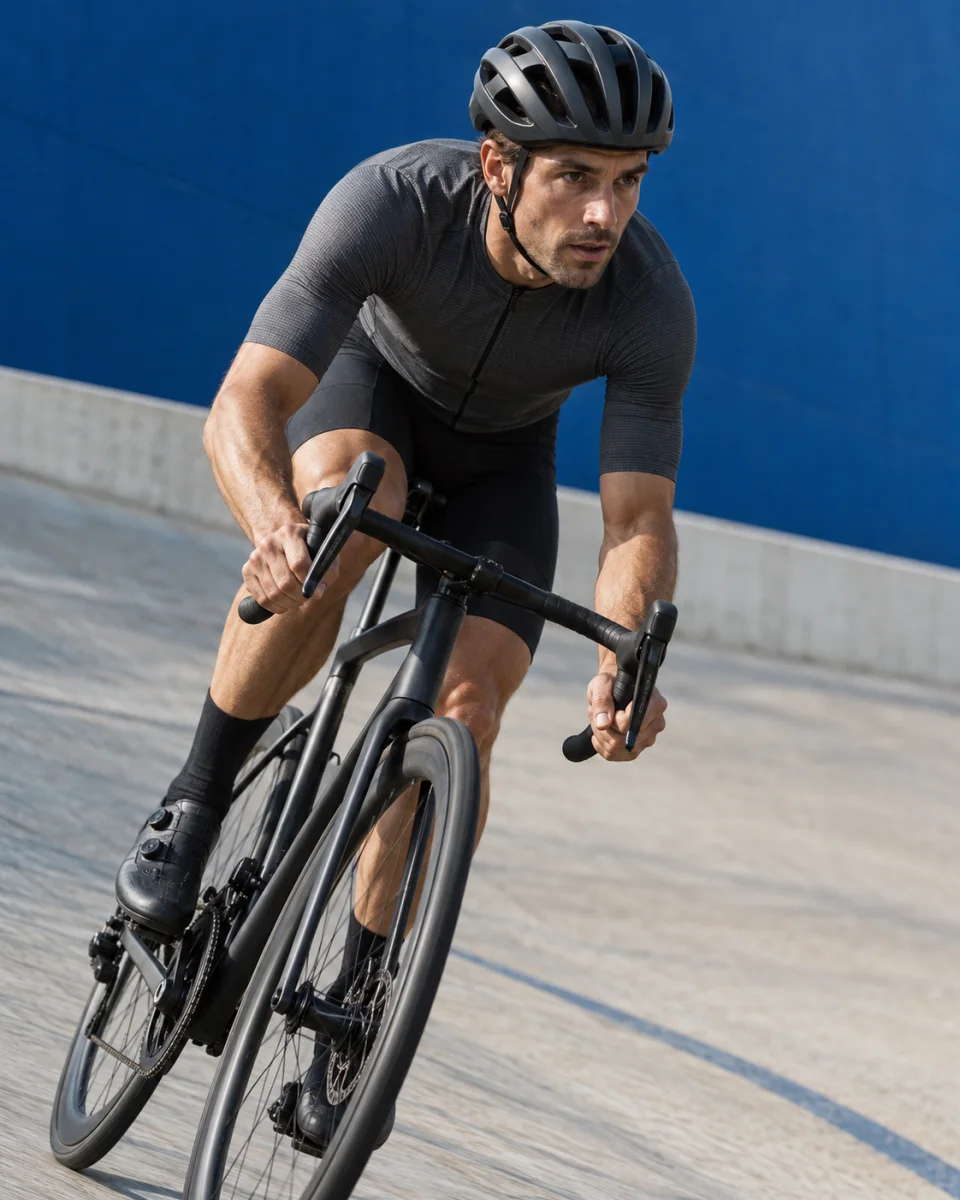
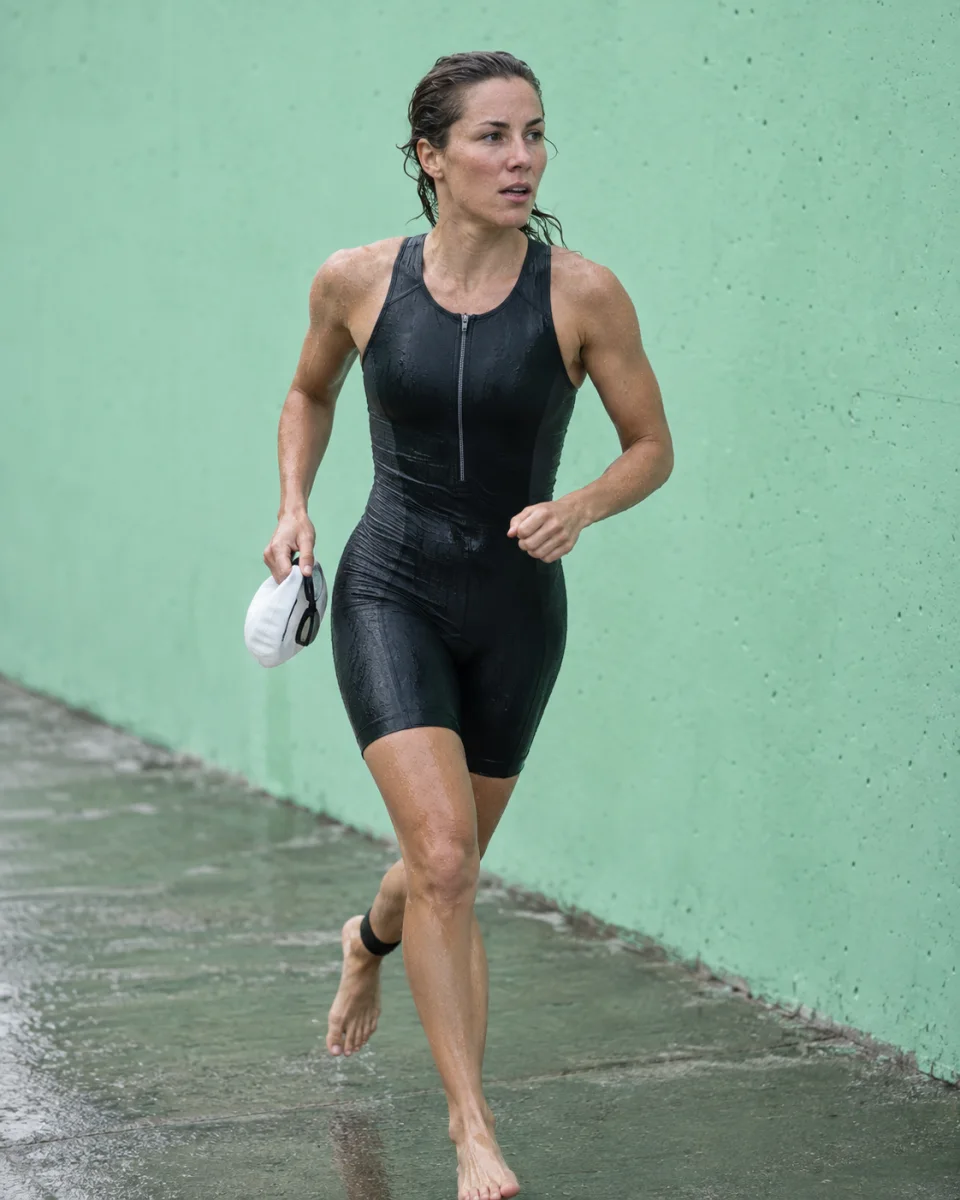
Turn measured stages into defensible thresholds, useful training zones and progress you can actually act on.
Start free · no credit cardRunning, cycling or triathlon: see more than a curve – see what it means for your training.
Swipe sideways for more examples
Threshold pace and heart rate in one usable result.
Power, lactate and training ranges brought together clearly.
A defensible foundation across multiple disciplines.
Images generated with AI. Product data is illustrative.
See where models agree and where interpretation matters.
Compare methodsLog-Poly-ModDmax (Jamnick 2018), Modified Dmax (Bishop 1998), Dickhuth, Delta, Mader — each with literature references.
Compare methodsZ2 ends at your measured LT1 (San Millán & Brooks 2018), not at a fixed Coggan percentage.
Metabolic ProfileVO₂max × VLamax quadrant chart after Mader & Heck 1986 — VLamax from your sprint test: Sprinter, Power, Diesel or Base?
Calculate zonesError propagation checks whether your improvement exceeds measurement noise — 95 %, 68 %, or not significant.
MLSS CalibrationGold-standard validation: rank all 6 methods against your own MLSS constant test. (Lab tier)
Lactate test analysisSwipe sideways for more perspectives
Link MLSS constant-load tests to step tests and compare methods for your own profile or your athletes.
Open lab demoCompleted studies with posted results – from interval and strength training to nutrition and recovery. Every study with the original numbers, the result in plain language and an assessment of what you can and cannot conclude as a coach.
Randomized · both groups completed the same training
The example chart is held until its original source has been verified successfully.
The summary is free. Result charts, data tables and the complete coaching interpretation come with Lab.
Key messageWith HIIT, VO2max rose from 31.5 to 35.4 ml/kg/min, with circuit training from 31.4 to 32.4; the group difference is statistically supported (ANOVA, p < 0.01). Oxygen uptake at the ventilatory threshold also improved more with HIIT.
Full dossier with LabKey messageWith and without cold water immersion, HRV, resting heart rate, sleep, perceived recovery and jump performance were nearly identical. The registry reports no statistical comparison; no measurable benefit of routine cold baths is apparent.
Full dossier with LabKey messageOnly one of six primary outcomes differed between groups: time to exhaustion (ANCOVA, p = 0.001). After mindfulness training it was on average no longer shorter under mental fatigue than in the control condition, whereas it still was in the waitlist group. For VO2max, Flanker reaction time, accuracy, N2 and P3 the group comparison was not significant.
Full dossier with LabStart free, upgrade when ready
Swipe sideways for more plans
0€forever
19,99€per year
49,99€per year
79,99€per year
Fast entry points for runners, cyclists, triathletes, coaches, and anyone calculating threshold values from test data.
Use the template for your next at-home test: preparation, bike and run protocol, measurement sheet and analysis steps in one document.
Answers to the most important search questions about lactate threshold, step tests, meters and training zones.
Yes. Enter power or pace, lactate values and optional heart rate from your step test. LactateThreshold calculates LT1, LT2 and individual training zones.
The analysis works with any meter that gives lactate values in mmol/L, including Lactate Pro 2, Lactate Plus, EKF Lactate Scout, Lactate Express and similar portable devices.
Lactate threshold describes an intensity where lactate production and clearance become important for endurance performance. LT1 helps define easier endurance work, while LT2 is close to your highest sustainable intensity.
Start at a low intensity and increase every 3 to 5 minutes, for example by 20 to 30 watts or 20 to 30 seconds per kilometer. Measure lactate at the end of each stage and enter the values.
LT1 marks the transition into measurable lactate accumulation and helps guide Zone 2. LT2 is closer to threshold performance and is central for tempo, FTP and race pacing.
The app compares 6 scientific methods: Log-Poly-ModDmax, Modified Dmax, Dmax, Dickhuth, Delta and Mader. You see not only one value, but also the methodological spread of your result.
Your next analysis starts with the measurements.Start analysisTracking-Einwilligung
Wir nutzen Google Analytics und den Meta-Pixel nur nach deiner Zustimmung, um Reichweite, Nutzung und Werbewirkung der Seite zu verstehen. Ohne Zustimmung werden keine dieser Cookies/Dienste geladen.