Calculate lactate curve online: step-test input and threshold output
Enter step-test workload and blood lactate values into an online lactate calculator to fit a curve, identify LT1 and LT2 thresholds, and map training zones.
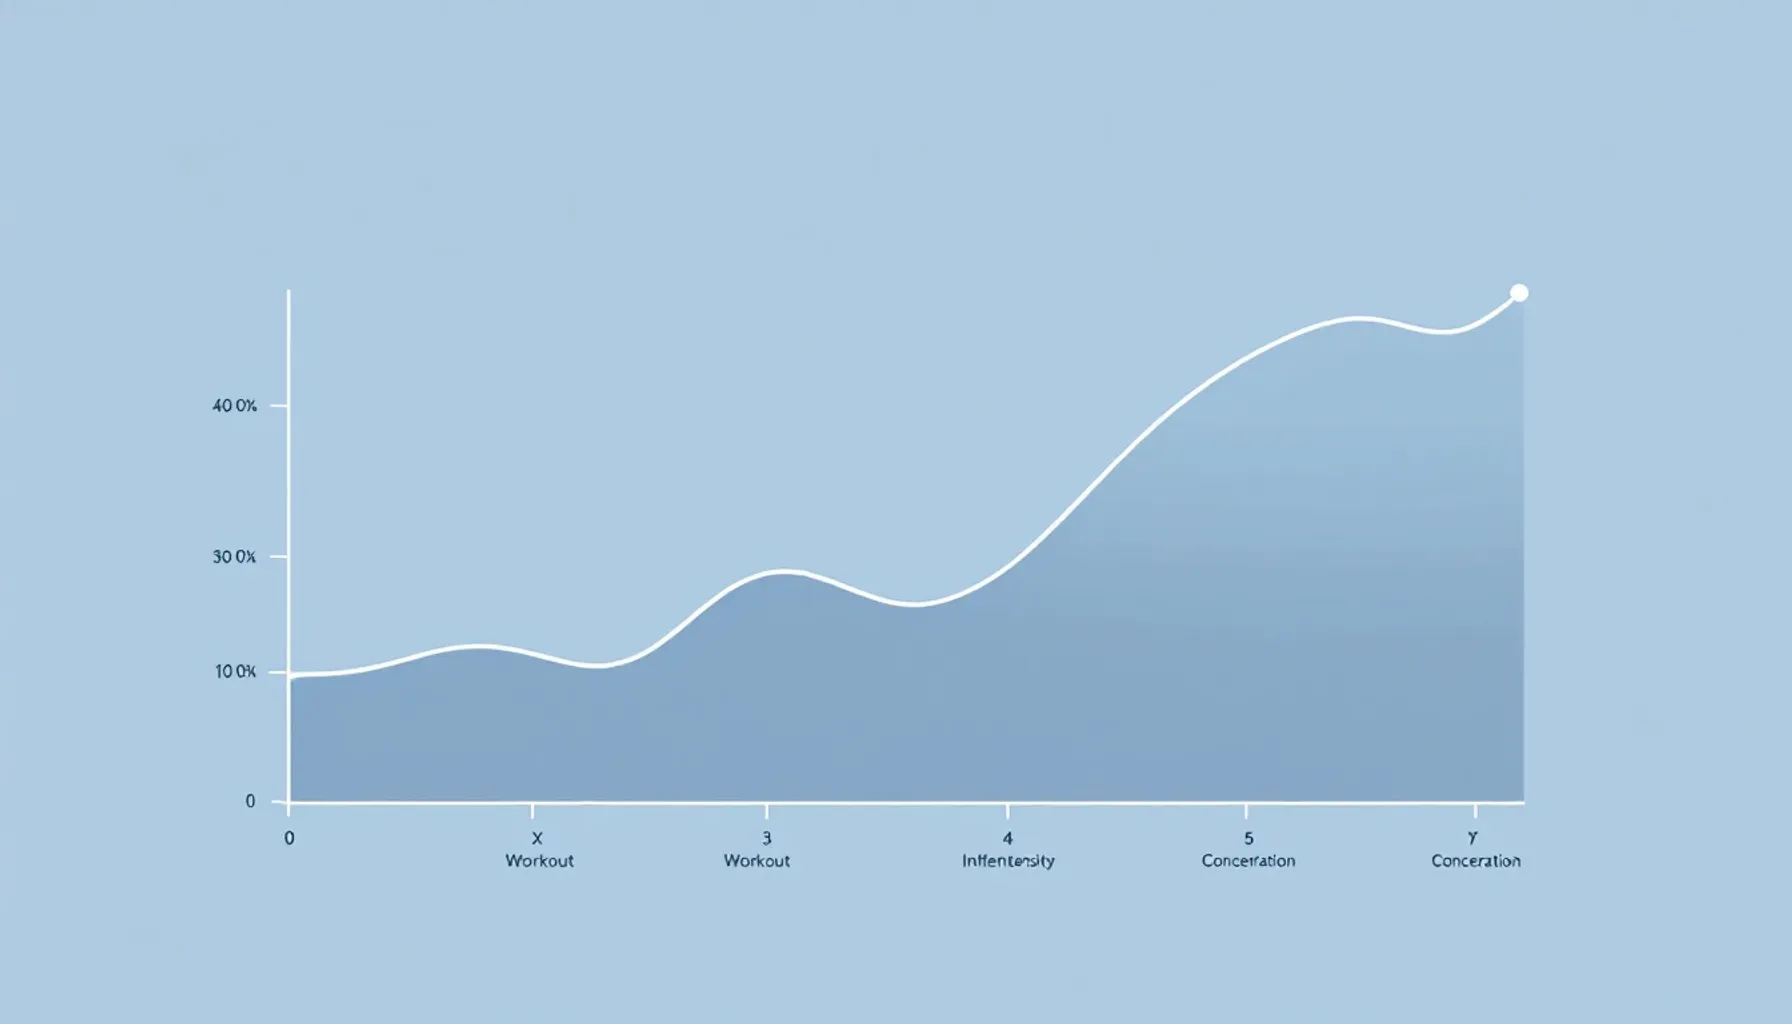
Calculate Lactate Curve Online: Step-Test Input, Curve Fitting, and Training Zone Output
Short answer: To calculate a lactate curve online, enter the workload (pace, power, or speed) and the corresponding blood lactate concentration for each step of your step test into an online lactate calculator. The tool fits a curve to those data points, identifies LT1 (first lactate threshold) and LT2 (second lactate threshold), and maps both thresholds to training zones. You need at least four to five paired data points to produce a reliable curve.
To calculate a lactate curve online refers to using a web-based tool to transform raw step-test data — workload and blood lactate values per step — into a fitted curve, threshold markers, and zone boundaries. Five key entities define this process: lactate curve (the plotted relationship between workload and blood lactate concentration), LT1 (first lactate threshold, marking the upper edge of aerobic base intensity), LT2 (second lactate threshold, often called the anaerobic threshold), step test (a structured incremental exercise protocol), and curve fitting (the mathematical method used to draw a smooth line through discrete data points). A sixth parameter, VLamax (maximal glycolytic rate), appears as an optional output in some calculators.
What a Lactate Curve Actually Shows
A lactate curve is a data object: workload on the x-axis, blood lactate concentration in mmol/L on the y-axis, with a smooth fitted line connecting the measured points from each step of a test.
The x-axis: workload units (pace, power, speed)
Workload can be expressed as cycling power in watts, running pace in min/km or min/mile, or swimming speed in m/s. The unit you choose determines how your training zones will be expressed at the end. If you test at 150 W, 200 W, 250 W, 300 W, and 350 W, your output zones will also be in watts.
The y-axis: blood lactate in mmol/L
Blood lactate concentration is measured in millimoles per litre (mmol/L). At low workloads, lactate production and clearance are roughly balanced, so the curve stays flat. As intensity increases, production begins to outpace clearance and the curve bends upward.
Why the curve bends: the two inflection points
The aerobic threshold (LT1) marks the first meaningful bend. The anaerobic threshold (LT2) marks where the curve steepens sharply. Identifying those two inflection points is the core output of any lactate curve calculation.
Inputs You Need Before You Start
Arriving at an online lactate calculator with incomplete or mis-formatted data is the most common reason results look wrong. (how to enter your step-test data) Use this checklist before entering anything.
Minimum required fields
Every step needs two values: workload (watts, pace, or speed) and blood lactate in mmol/L. Four to five steps is a practical minimum for curve fitting — fewer points give the algorithm too little to work with. Most calculators also expect a rest lactate value taken before the test begins, which anchors the low end of the curve.
Optional fields that improve curve accuracy
Heart rate per step (in bpm) allows the tool to plot a second curve alongside lactate, which can help cross-validate threshold positions. Step duration is useful context, particularly when comparing tests over time. Some calculators accept RPE (rate of perceived exertion) per step, though this is rarely used in automated threshold detection.
How to handle a missing or outlier value
If one lactate reading looks implausible — a value that drops between two rising steps, for example — check the measurement first. A poorly collected finger-prick sample or a contaminated strip can produce a spurious reading. Most online tools let you exclude a single point before fitting. If you exclude a value, note it so you can account for it when comparing future tests.
How Online Lactate Calculators Fit the Curve
Two tools can receive identical raw data and return slightly different LT1 and LT2 positions. Understanding why prevents unnecessary confusion about which result to trust.
Polynomial vs. spline fitting
Polynomial regression fits a single equation — typically a third- or fourth-degree polynomial — to all data points at once. It is computationally straightforward and produces a smooth curve, but can overshoot at the edges of the data range. Spline interpolation fits separate curve segments between adjacent data points, joining them smoothly at each node. Splines tend to follow the measured points more closely, which can shift where the algorithm detects an inflection.
Common threshold detection methods: Dmax, fixed mmol/L, log-log
- Dmax method: Draws a straight line from the first to the last data point on the fitted curve, then finds the point on the curve with the maximum perpendicular distance from that line. This point is reported as LT2 (or LT1 in some implementations).
- Fixed concentration method: Sets a threshold at a predetermined lactate value — commonly 2 mmol/L for LT1 and 4 mmol/L for LT2. These are population-level conventions, not universal physiological constants; individual athletes may have thresholds at different concentrations.
- Log-log method: Plots both axes on a logarithmic scale, where the lactate curve becomes more linear, and identifies the breakpoint where the slope changes.
Why method choice shifts the threshold position
Each method answers a slightly different question about the same curve. Dmax finds a geometric maximum deviation; fixed concentration finds where the curve crosses a number; log-log finds a slope change. A tool using Dmax will often place LT2 at a different workload than one using the 4 mmol/L fixed method — sometimes by 10–20 W or several seconds per kilometre in a fictional worked example. When comparing results across tools or across time, use the same method consistently.
Worked Example: From Raw Step-Test Numbers to a Lactate Curve
All numbers below are fictional and are presented as an illustration of the workflow, not as reference values or performance benchmarks.
The input table
Fictional scenario: Trained amateur cyclist, 5-step incremental test, 5 minutes per step, values measured with a handheld lactate meter.
| Step | Power (W) | Heart Rate (bpm) | Lactate (mmol/L) | Notes |
|---|---|---|---|---|
| Rest | — | 62 | 0.9 | Resting baseline |
| 1 | 150 | 118 | 1.1 | Flat section of curve |
| 2 | 200 | 138 | 1.4 | Still aerobic, curve rising slowly |
| 3 | 250 | 158 | 2.1 | LT1 region — first bend visible |
| 4 | 300 | 174 | 3.8 | LT2 region — curve steepening |
| 5 | 350 | 188 | 6.7 | Above threshold, sharp rise |
Reading LT1 and LT2 on the output curve
After entering these fictional values, the calculator fits a curve through all six points including the rest measurement. The curve stays nearly flat from rest through Step 2, then bends at Step 3. In this example, LT1 detection (using Dmax or a 2 mmol/L fixed method) lands near 245–255 W. The steeper bend between Steps 4 and 5 places LT2 near 290–305 W, depending on the method used.
Mapping thresholds to training zones
Using the fictional example output above:
| Zone | Label | Power range |
|---|---|---|
| Zone 1 | Recovery | below 245 W |
| Zone 2 | Aerobic base / LT1 zone | 245–275 W |
| Zone 3 | Tempo | 275–290 W |
| Zone 4 | Threshold / LT2 zone | 290–305 W |
| Zone 5 | Above threshold | above 305 W |
Zone boundaries vary by the model the tool uses — 5-zone, 7-zone, or polarised. Check which model your calculator applies before comparing zones with a training plan.
The most common input error in this step
Omitting the rest lactate value. Without a resting baseline, the curve has no anchor at the low end, and the fitted line may start too high, pulling LT1 upward. Measure and enter the pre-test resting value every time.
Interpreting Your Results: LT1, LT2, and Training Zones
What LT1 tells you about aerobic base intensity
LT1 marks the workload below which lactate remains close to resting levels. Training at or just below LT1 — often called Zone 2 or aerobic base work — is where the aerobic energy system operates with minimal lactate accumulation. How you apply this number in a training structure depends on your goals and current fitness; a qualified coach can help translate the threshold into a practical plan.
What LT2 tells you about threshold intensity
LT2 marks the workload above which lactate accumulates faster than it can be cleared. Sustained efforts above LT2 are time-limited. How you use this number in a training plan is a decision best made with a coach or sports science professional, not from a single data point in isolation.
How zone boundaries are derived from the two thresholds
Most online calculators place LT1 and LT2 as anchors and distribute zones proportionally between them and above LT2. (training zones derived from thresholds) Zone labels and boundary percentages differ between models, so "Zone 3" in one system may not equal "Zone 3" in another. Confirm which model your tool uses before importing zones into a training plan.
When to re-test and recalculate
Re-testing makes sense after a significant training block, after a period of illness or detraining, or when perceived effort at a given workload has shifted noticeably. There is no universal re-test interval that applies to all athletes; the right timing depends on your training phase and how you use the data. A coach or sports scientist can advise on appropriate timing.
VLamax as an additional output
VLamax — maximal glycolytic rate — is an additional metabolic parameter some calculators estimate from step-test data. It reflects how quickly the anaerobic glycolytic pathway produces lactate, expressed in mmol/L/s. Some tools include it as an output alongside LT1 and LT2; others do not. Check the tool's feature list before entering your data if VLamax output is relevant to your analysis.
Choosing the Right Online Tool for Your Sport and Data
Key features to check before entering your data
- Does the tool accept your workload unit (watts, pace, or speed)?
- Which curve-fitting method does it use — polynomial or spline?
- Which threshold detection method does it apply — Dmax, fixed mmol/L, or log-log?
- Can you export the curve and zone output?
- Does it display the fitted curve visually, or only numeric outputs?
- Does it include VLamax estimation if that matters to your analysis?
Sport-specific considerations
A lactate curve calculator for cycling needs power input in watts. A lactate threshold calculator for running should accept pace in min/km or min/mile. Swimming calculators use speed in m/s or per-100m split times. Multi-sport athletes need a tool that can store separate tests per sport, since lactate thresholds are sport-specific and do not transfer directly between disciplines.
Questions to ask about method transparency
- Does the tool document which threshold detection method it uses?
- Can you switch between methods to compare outputs?
- Does it indicate uncertainty around the threshold position?
A tool that shows its method is more useful for comparing tests over time than one that returns a number without explaining how it was calculated. LactateThreshold.online is built around this transparency: you enter step-test data and see which method produced each output, with the fitted curve displayed alongside the numeric thresholds.
FAQ
What data do I need to calculate a lactate curve online? At least four to five paired data points: workload (watts, pace, or speed) and blood lactate in mmol/L for each step. A resting lactate value before the test starts improves curve accuracy. Heart rate per step is optional but useful for cross-referencing threshold positions.
What is the difference between LT1 and LT2 on a lactate curve? LT1 marks the workload where lactate begins to rise above resting levels — the upper boundary of aerobic base intensity. LT2 marks where lactate accumulates faster than it can be cleared, defining threshold intensity. Both are identified as inflection points on the fitted curve.
Can I calculate a lactate curve without a lactate meter? No. A lactate curve requires measured blood lactate values from each step. Without a meter, there is no y-axis data to fit. Heart rate or power alone cannot substitute for measured lactate when calculating LT1 and LT2 from a lactate curve.
Why do different online calculators give different LT1 and LT2 values from the same data? Different tools use different curve-fitting methods (polynomial vs. spline) and different threshold detection methods (Dmax, fixed mmol/L, log-log). Each method answers a slightly different question about the same curve, which shifts the reported threshold position. Use the same method consistently when comparing tests over time.
How often should I recalculate my lactate curve? There is no universal interval. A common practice is to re-test after a structured training block, after significant detraining, or when perceived effort at a known workload has changed. A coach or sports scientist can advise on the right re-test timing for your training phase.
What is VLamax and does an online lactate calculator include it? VLamax is the maximal rate of lactate production by the anaerobic glycolytic pathway, expressed in mmol/L/s. Some online lactate calculators estimate it from step-test data alongside LT1 and LT2; others do not. Check the tool's feature list before entering your data if VLamax output is relevant to your analysis.